Turn Boring Numbers Into Shareable Visuals: The Stat Highlight Preset
Data tells the story, but presentation sells it. The Stat Highlight preset turns key metrics into bold, professional visuals for reports, social media, and presentations.
You just closed your best quarter ever. Year-over-year revenue up 47%. You want to share it on LinkedIn, drop it into your investor deck, and post it in the company Slack. But “47% revenue growth” typed into a text post doesn’t stop anyone mid-scroll.
The alternative? Open Canva, pick a template, fight with font sizes for 20 minutes, export at the wrong resolution, and settle for something that looks “fine.” All for a single number.
How to Use the Stat Highlight Preset
The Stat / Data Highlight Content Type creates bold, professional data visuals where the number is the hero. You fill in three fields:
- Metric Value: “47%”
- Metric Label: “Year-over-year revenue growth”
- Context: “Q1 2026”
The preset makes the number the dominant visual element — large, bold, and impossible to miss. Clean, modern styling with a dark gradient background handles the rest.
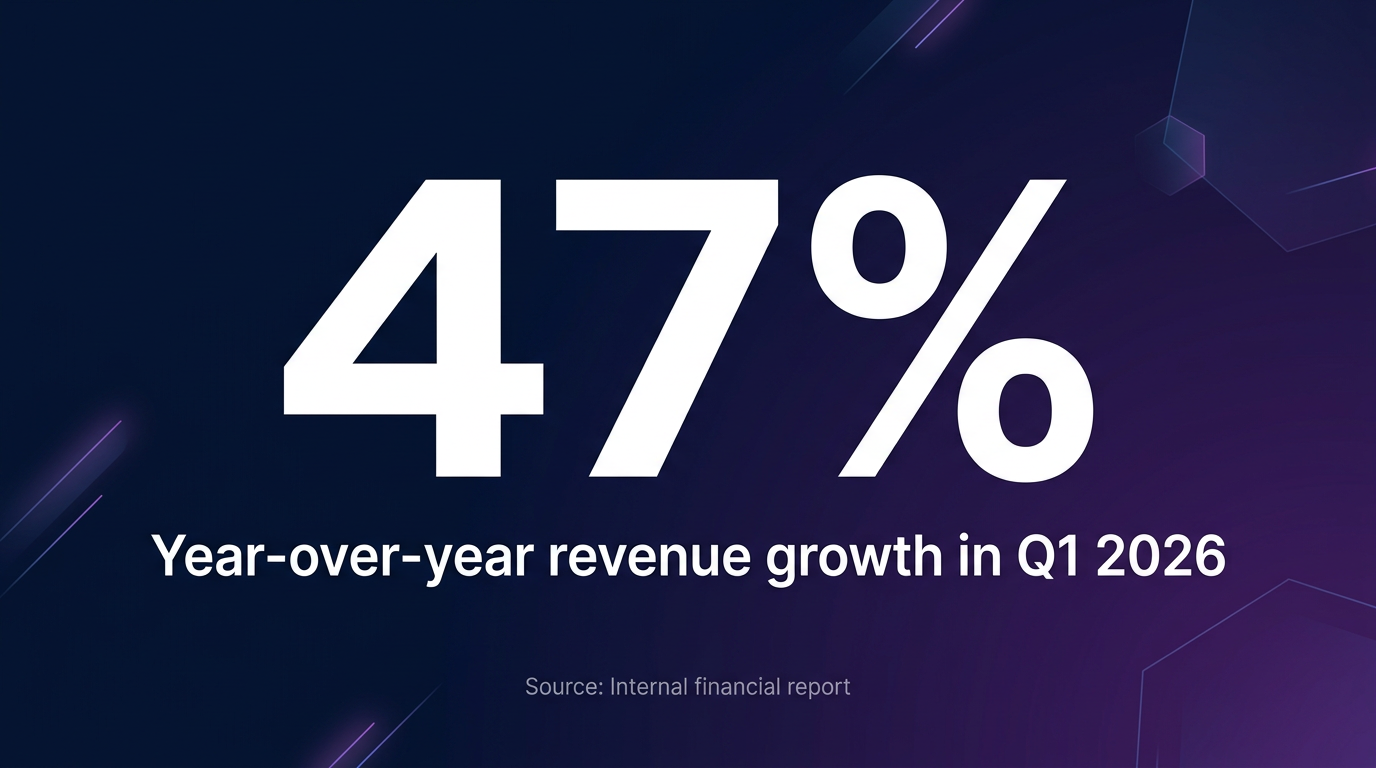
Generated with the Stat Highlight preset
Use Cases That Hit Different
This preset works for any metric that deserves attention:
- Investor updates: “3x ARR growth” — drop it into your board deck
- Social proof on LinkedIn: “10,000 customers served” — make it a visual post
- Internal celebrations: “99.9% uptime” — post it in Slack to rally the team
- Sales enablement: “42% faster deployment” — arm your reps with shareable proof points
Why This Matters
- Scroll-Stopping Power: Visual data posts get 2-3x more engagement than text-only posts on LinkedIn and Twitter.
- Brand Consistency: Every stat visual comes out with the same professional styling. Your quarterly reports look like they came from the same design team.
- Speed: Generate a presentation-ready data visual in 15 seconds, not 15 minutes.
Make Your Numbers Impossible to Ignore
Your data is impressive. Make sure it looks impressive too.
Try the Stat Highlight template in our Playground and turn your next big metric into a visual that gets shared.